
Context
Nowadays, user experience is central and everyone needs to take care about it before publishing applications and solutions to end users inside a company. With the page diagnostics for SharePoint tool you can analyze single pages performances and determine which elements are making your pages running slowly. This tool only works for SharePoint Online and cannot be used on a SharePoint system page. So let’s have a deeper look together now!
Analyze a single page
First, you need to install the extension for Edge or Chrome browser then you just need to browse a SharePoint Online page you want to analyze and click on the extension icon (located top right) to start the analysis.
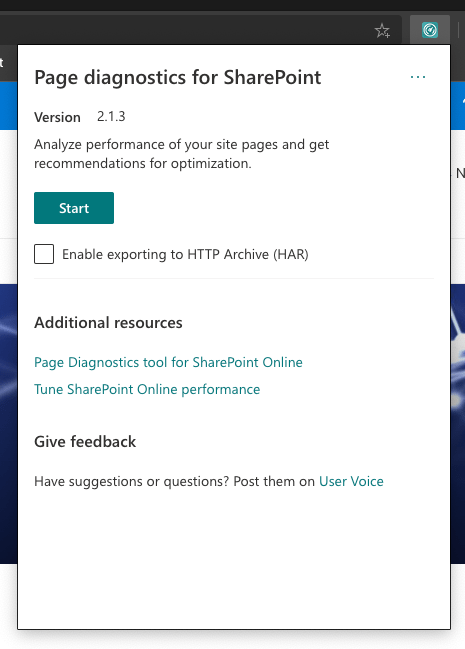
You can check Enable exporting to HTTP Archive (HAR) if you want to export a .har file which is a JSON-formatted file used for troubleshooting pages performances and contains detailed performance data about web pages it loads.
Then you just need to click on Start button to begin the analysis…

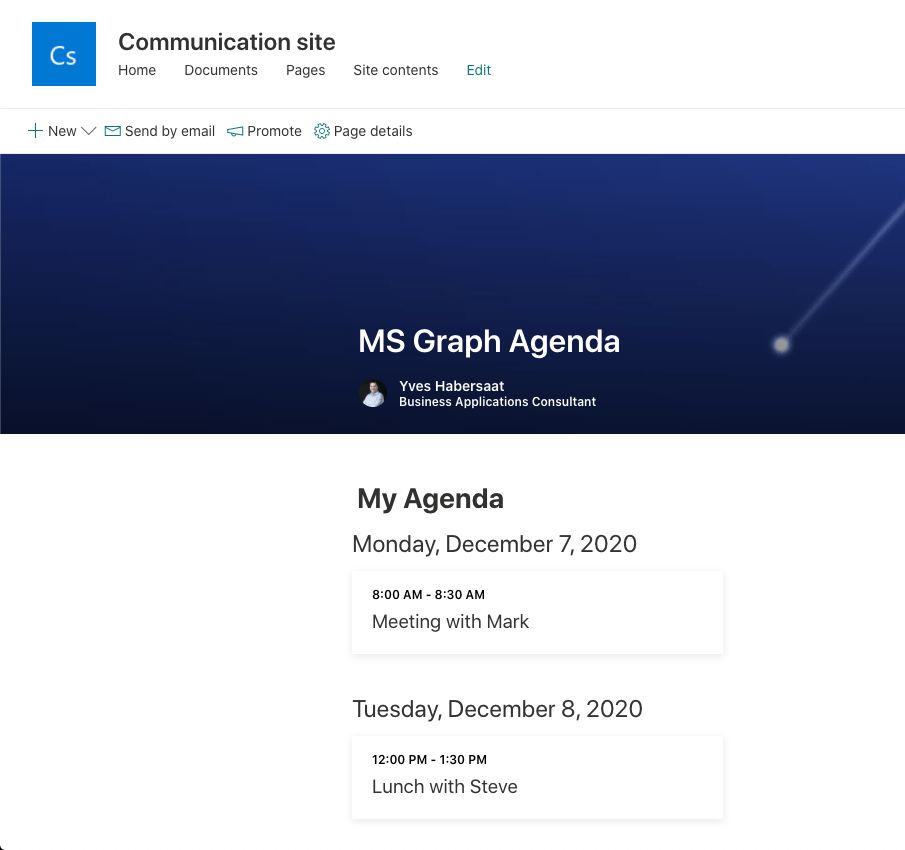
In my case, I started the analysis on a page I made on a out of the box Communication site with a custom SPFx web part inside that I have developed for this article.
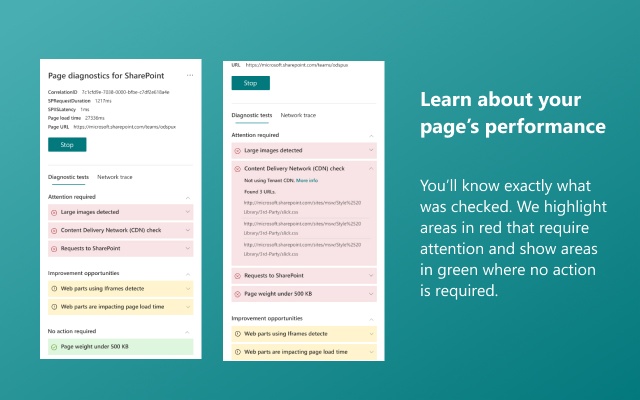
Diagnostic tests tab
Diagnostic tests tab shows you factors that may impact performances of your page. It can be usefull to know that your custom web part is making too much refresh and impact performances or that Microsoft 365 CDN is not enabled for your tenant. Results are analyzed using pre-defined rules determined by Microsoft, see references at the end of this article to know more about this topic.


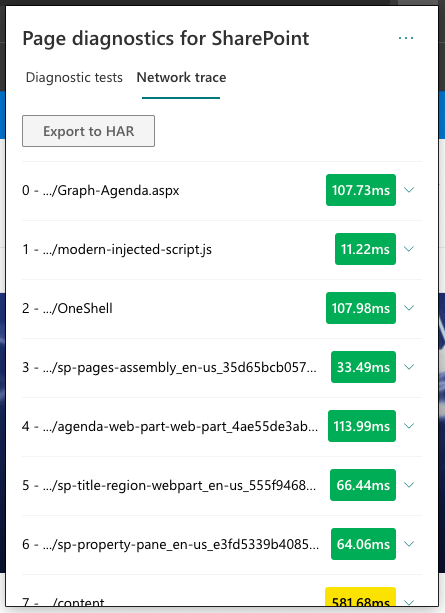
Network trace tab
Network trace tab shows you all network calls from your page to SharePoint service. Sometimes it’s usefull to know which elements have high latencies and investigate if you can optimize some settings in your network, your tenant or maybe inside your custom web part with data caching for example.
Inside this tab, latency metrics are:
- Green: < 500ms
- Yellow: 500-1000ms
- Red: > 1000ms

Common use case
The common use case for this tool is when you want to understand better the bad performances of a single SharePoint Online page and investigate the root cause deeper. In some cases, Microsoft support could help to understand better the problems so don’t hesitate to export as .har file and send it for deeper investigations with support engineers.
Finally, this tool won’t help you to design your pages, it will only give you technical informations about pages performances and after the page analysis you’ll have to investigate on your side in the context of your page to understand which are the potential optimizations to implement in your environment. In my case, I used this extension lots of time to check which custom web parts (self-developed or third-party) inside my page had too much calls to the SharePoint service to optimize the projects code or to check if Microsoft 365 CDN was enabled ot not in the tenant.
Hope this article will help you to find some potential performance optimizations inside your Share Point Online pages!
Resources
https://docs.microsoft.com/en-us/microsoft-365/Enterprise/page-diagnostics-for-spo
https://docs.microsoft.com/en-us/microsoft-365/Enterprise/tune-sharepoint-online-performance
https://docs.microsoft.com/en-us/sharepoint/modern-experience-performance
